Introduction to R and Data Visualisation
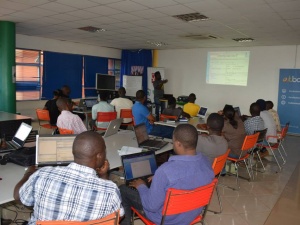
On Saturday 1st February, Outbox Research hosted the first R for Data Training and Visualisation training at Outbox from 10 am to 1pm.
The trainer Richard Ngamita, a data Analyst/Engineer and Developer at Refugees United, who has also worked with google Ireland, building tools to protect users from online abuse, covered the following in his presentation;
- Introduction to R basics
- Introduction to procedural programming in R
- R data structures
- Visualising Data in R
- Data mining in R
The training started with Installation of R on different systems such as MAC, Microsoft Windows and Linux.
In the introduction, we looked at the R environment, how to execute R commands, tips on getting started with R, Object types, Vectors and arrays, Data frames, among others. Find attached the presentation slides.
This training was organised for existing and prospective data analysis practitioners in Government and Industry.
R is the most popula data mining and statistics package in the world, and is free to use. It is also easy to use due to a range of intuitive graphical user interface for statistics, data mining and interactive visualization. It is used by a growing number of commercial and Government Organisations and is also the tool of choice of elite data mining competition winners.
R is Open source, flexible and customisable. Over 4,000 R packages are available as extensions to the base environment, constituting one of the largest and most up-todate collection of cutting edge Anallytics tools in the world. It is also one of the most visually specullar and universally applicable data Visualization tool.
At the end of the training, attendees were expected to have basic skills, resources, guidance to immediately and self sufficiently begin to use R in their work.
Comments
Well, am both a statisticians
Add new comment